
Introduction
In the rapidly evolving landscape of Generative AI (Gen AI), managing the scale and cost of Large Language Models (LLMs) presents a formidable challenge for enterprises diversifying their application portfolios. As organizations increasingly integrate these powerful tools across various services, the absence of comprehensive visibility and cost controls can easily steer budgets into the red. Karini AI steps in as a game-changer, offering a meticulously designed dashboard that not only sheds light on the otherwise opaque realm of Gen AI expenditures but also puts the reins of cost management firmly in the hands of businesses.
Exploring Karini’s Dashboards
Karini’s dashboards allow you to examine your cost, usage, and resource statistics thoroughly. They enable you to identify cost drivers, the most widely used resources, such as models and connectors, and overall statistics about data ingestion and deployment completions.
It offers the following capabilities:
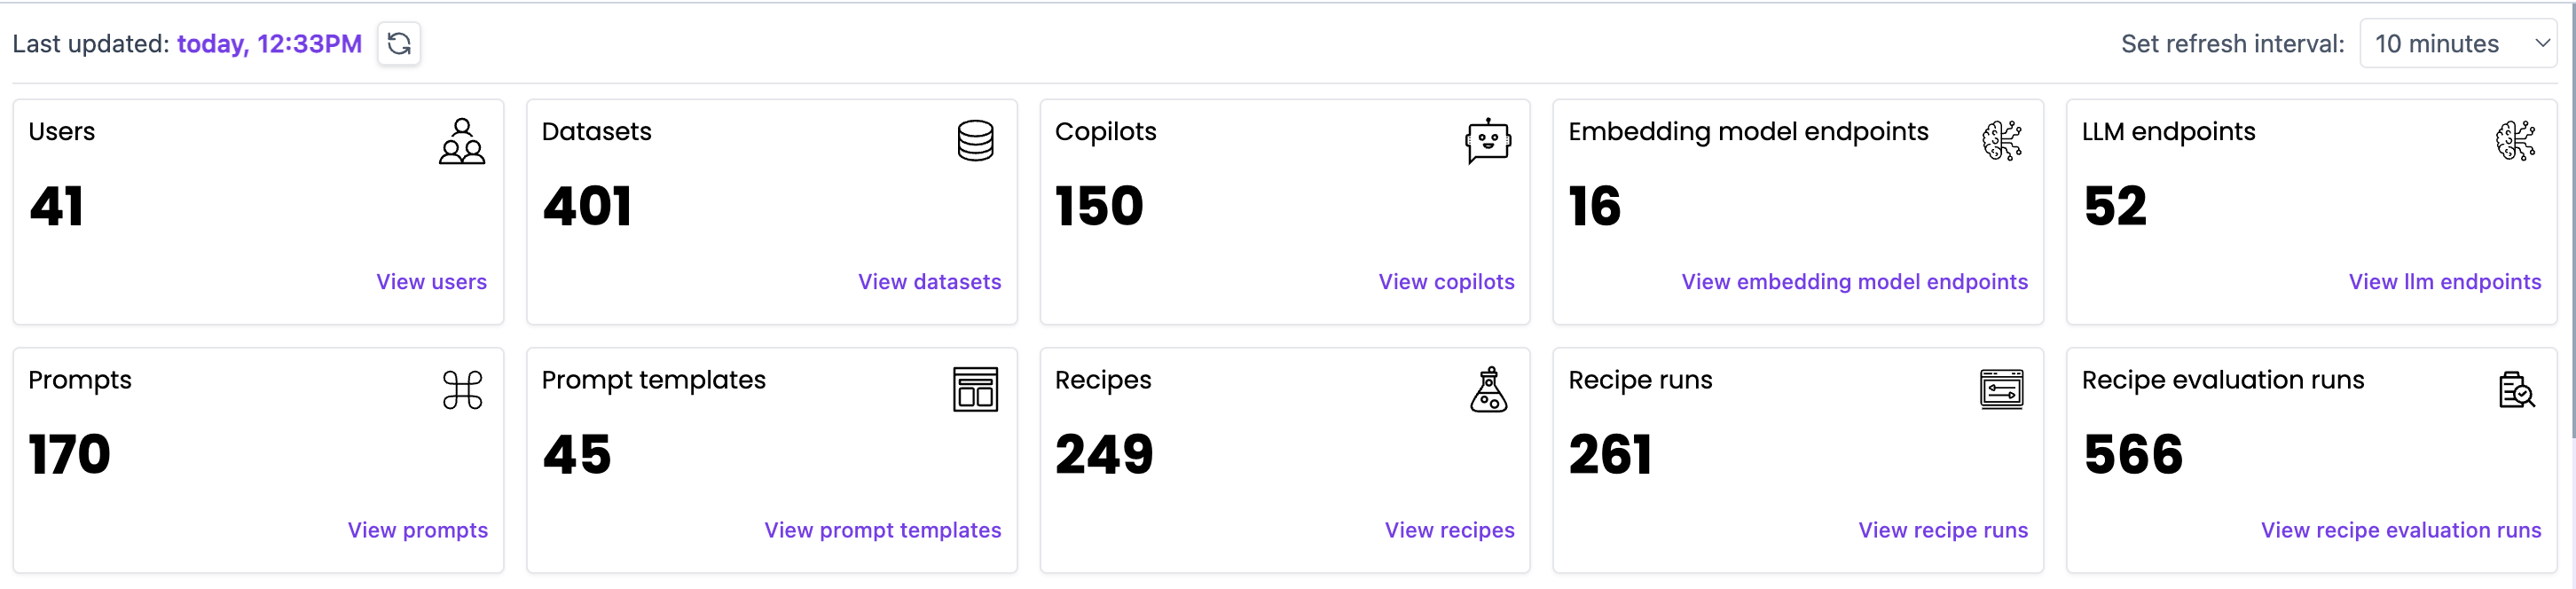
- Statistical Overview: Karini’s statistics dashboards offer you a single pane of glass to view all your resources, such as users, models, data connectors, recipes, prompts, copilots, embedded items, and recipe runs within your organization. You can get a high-level overview of your complete portfolio, and you can also get detailed analysis by diving deeper into each stats tile. In the following example, 52 LLM endpoints and 16 embedding model endpoints have been registered in Karini’s model hub within your organization. You can click the link to view the details for deeper analysis.
The following screenshot shows an example of a statistical overview of an organization’s assets in Karini.
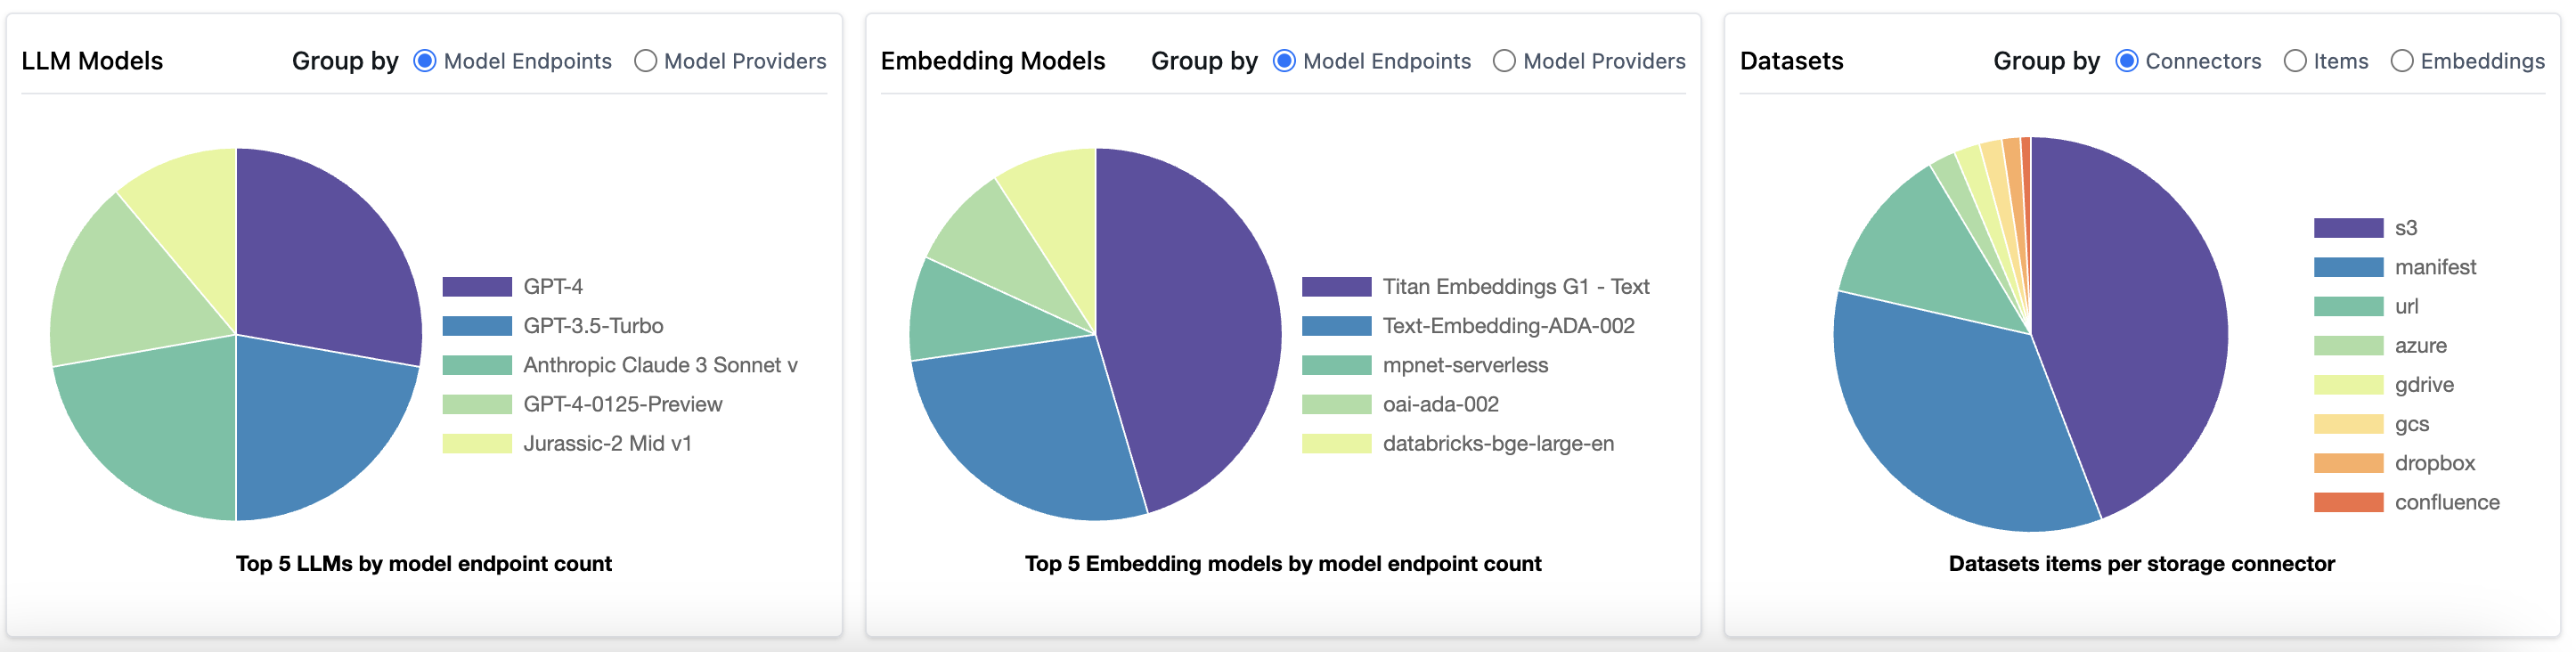
You can also review the resources and data statistics by grouping them by dimensions to see their distribution. For example, you can view all the registered model endpoints within your organization in Karini’s model hub, grouped by their model provider or model type. You can also view all the dataset items grouped by the data connectors using which the data was sourced.
The following screenshot shows an example of a distribution of assets within an organization in Karini.
Cost and usage monitoring: Karini's cost analysis dashboard features an intuitive interface that allows you to easily visualize, understand, and monitor your cost and usage trends over time. You can review your usage and costs via the main dashboard or explore specific resources like endpoints or copilots on their respective pages.
- Visualize spend by endpoints and copilots: The primary cost drivers for generative AI applications are the model endpoints, where costs accrue based on token usage. Karini's dashboards enable you to track spending across these model endpoints effectively. Additionally, you can monitor expenditures on copilot applications to analyze usage patterns and manage resources efficiently.
- Filter and group your data: Dig deeper into your data by flirting based on date range and grouping your resources. For example, you can visualize your monthly cost for the last three months grouped by the copilots or daily costs for the previous month grouped by the LLM endpoints. Karini’s dashboards show the cost and provide deeper insights by showing the number of API requests and token counts for the selected date and resources and delivering insights into your cost and usage patterns over the period chosen.
- Use granular filtering: Along with filtering by date range and grouping by resources, you can also visualize your costs and usage by selecting monthly, daily, and hourly granularity. This helps provide deeper insights into the costs, API requests, and associated token counts to identify trends, pinpoint cost drivers, and detect anomalies.

Benefits:
Karini's Dashboards offer a range of benefits designed to enhance business operations and efficiency:
- Comprehensive Overview: Karini Dashboards provide a "single pane of glass" to view and assess your portfolio. This allows for both high-level exploration and detailed analysis, ensuring you clearly understand your assets and their performance.
- Trend Analysis and Anomaly Detection: With Karini, you gain access to deep insights that help identify usage patterns and spot anomalies. This feature is crucial for proactive management and maintaining the integrity of your applications.
- Cost Management: The dashboards enable you to pinpoint and track the main expense drivers. This is essential for maintaining budget control and avoiding overspending.
- Usage Visibility: Given that large language model (LLM) applications can become costly, Karini provides detailed visibility into application usage. Businesses can monitor API requests and token consumption, which aids in budget planning and spending monitoring and ensures that resource use aligns with budgetary expectations.
Conclusion:
Karini’s platform is a game-changer for Operational Transparency and Budget Management. Organizations gain unparalleled insight into their expenditures by offering a meticulous breakdown of costs and usage metrics. This level of transparency empowers them to optimize their deployment of LLMs precisely, ensuring that resources are allocated with maximum efficiency, fostering innovation, and streamlining operations. With Karini's dashboard, organizations can closely monitor model spending, performance, and application usage, making it an indispensable tool for those looking to leverage Gen AI while fully maintaining fiscal responsibility.


